Version 2.0
Last Updated: 2026-04-10
Last Updated: 2026-04-10
IMPORTANT: Large-Scale Performance Load Testing & Deployment PlanningWhile wxO is designed to scale elastically, we maintain optimal utilization ratios to operate the system effectively. If you plan to conduct large-scale performance load testing, please notify wxO support at least one week in advance. This allows us to:
- Ensure the system is properly prepared for your test
- Monitor system behavior together with you during the test
- Provide guidance and support throughout the testing process
- Intended rollout schedule
- Expected user growth projections
- Anticipated usage patterns
About This Guide
This is the restructured version of the wxO Performance Guide, organized by the correct architecture hierarchy:- Agents (highest level) - Orchestrate and reason
- Flow (wxO Agentic Workflow) - Sequences Agents, Tools, and People
- Tools (execution level) - Flow, Python, Langflow, API, MCP, and Knowledge Tools.
Document Structure
This guide is organized into modular sections for easier maintenance and updates:- Introduction and Overview (this document)
- Understanding Performance Testing (this document)
- Agent Performance - Dedicated document
- Flow Performance - Dedicated document
- Tool Performance - Dedicated document
- Knowledge Performance - Dedicated document
- Accessing Performance Data (this document)
- Quick Reference (this document)
Introduction and Overview
Purpose of This Guide
This guide helps you understand, measure, and optimize the performance of your agents, flows, and tools in watsonx Orchestrate (wxO). Whether you’re building approval workflows, data processing pipelines, or interactive agents, understanding performance characteristics at each level is essential for delivering excellent user experiences.Balancing Performance with Quality
⚖️ Speed is Not EverythingIn agentic solutions, optimal performance is about finding the right balance between:
- Response Time: How quickly the system responds
- Information Relevancy: How well the response addresses the user’s needs
- Accuracy: How correct and reliable the information is
- Engagement Experience: How natural and helpful the interaction feels
Who Should Use This Guide
This guide is designed for:- Developers building agents, flows, and tools
- Architects designing wxO solutions
- Technical leads responsible for performance and SLAs
- DevOps engineers monitoring production systems
Understanding the wxO Architecture
wxO follows a hierarchical architecture where each level has distinct performance characteristics: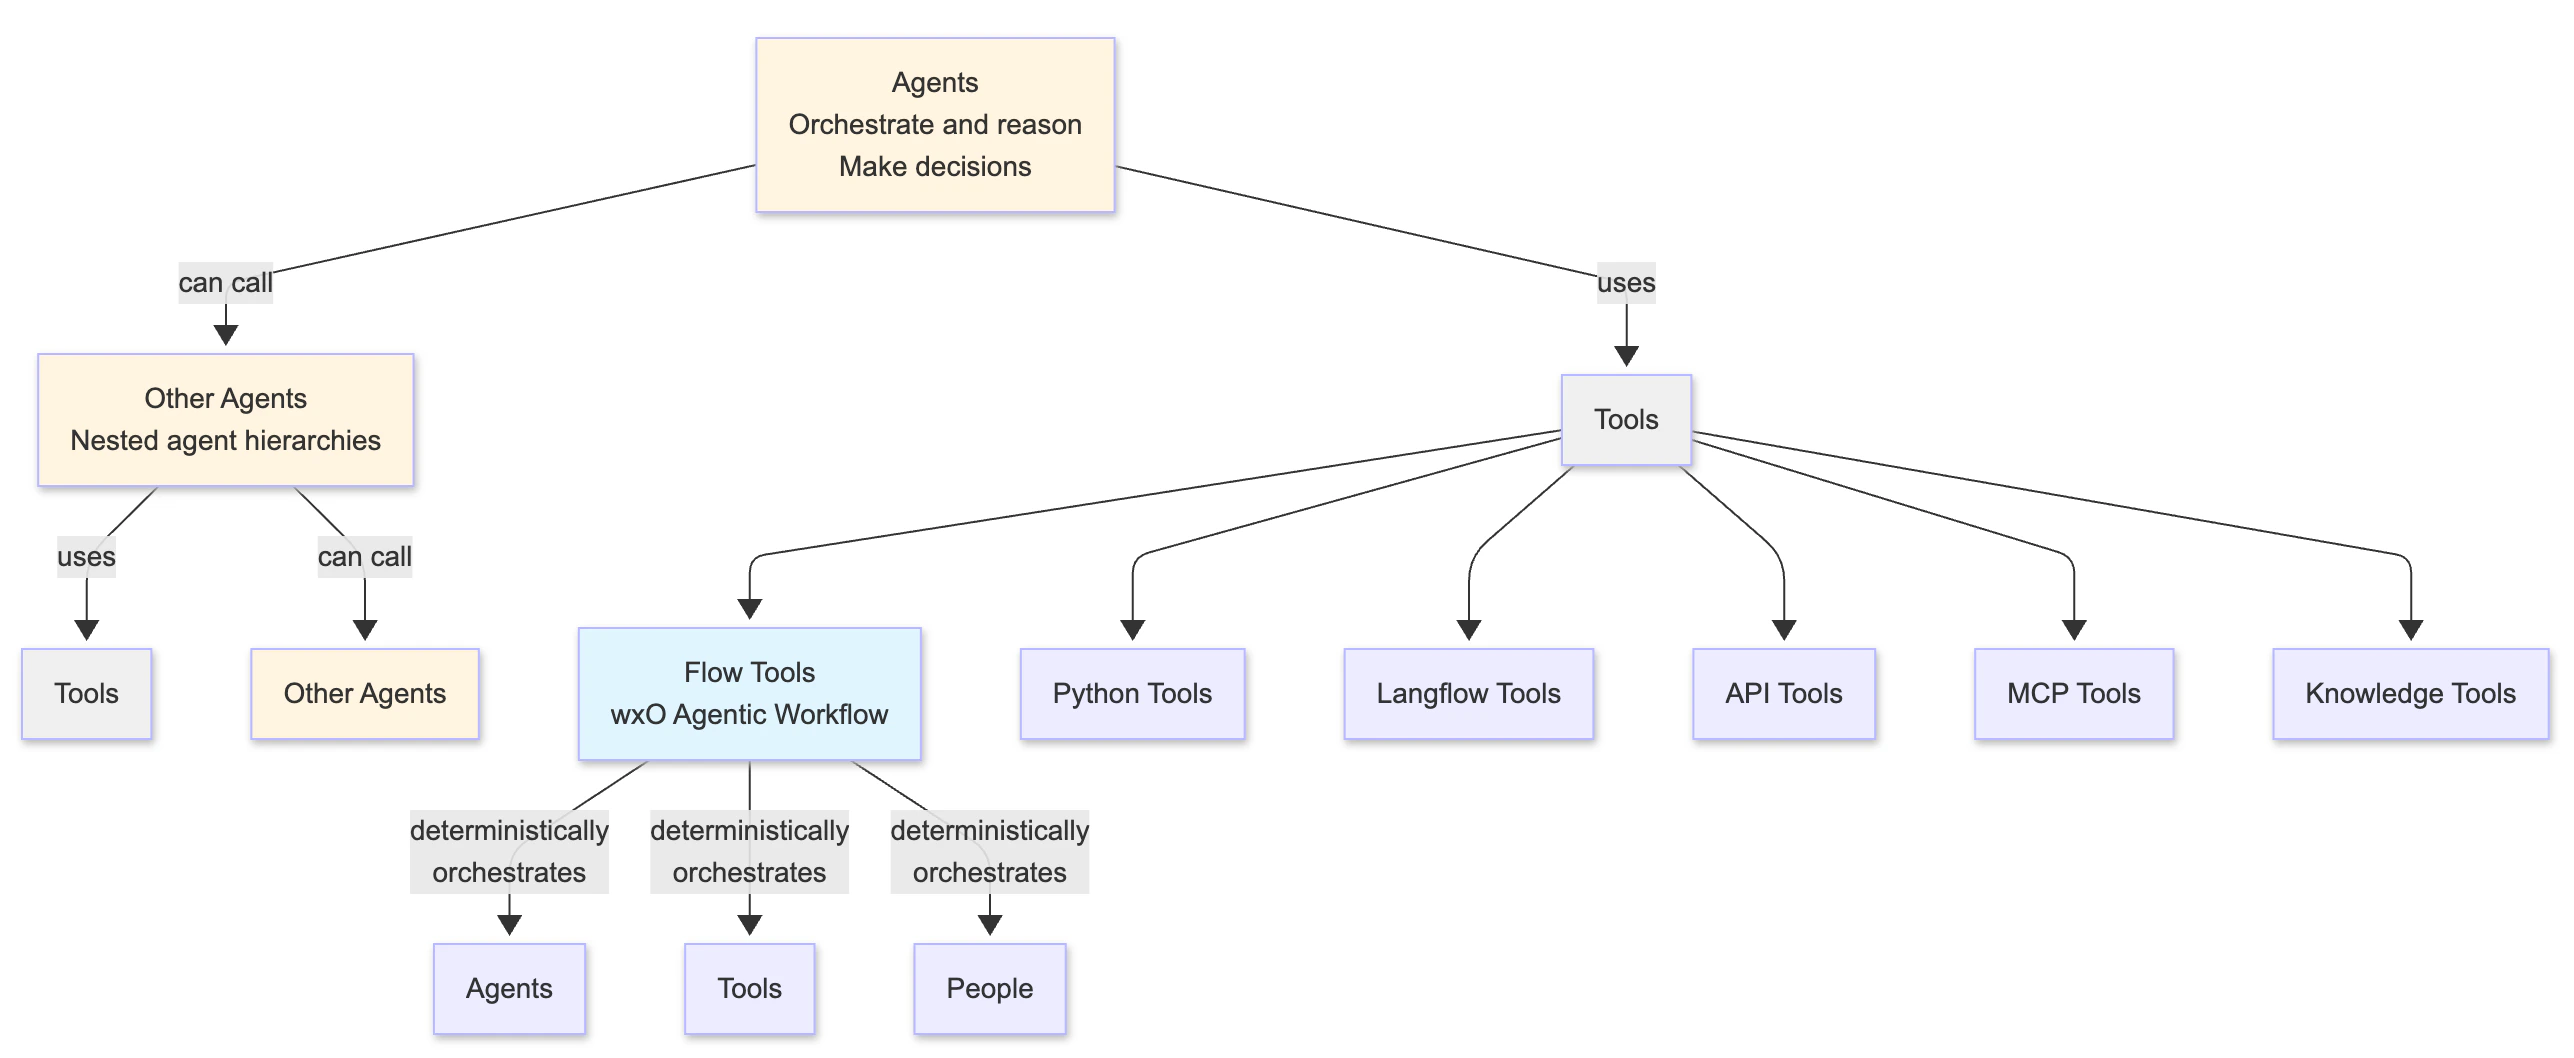
- Agents are the highest level - they orchestrate workflows and make decisions by using tools
- Agents can call other Agents: An agent can use another agent as a tool, which in turn can call other agents and tools, creating nested agent hierarchies
- Tools are the execution layer that agents can use:
- Flow (wxO Agentic Workflow): A stateful workflow tool that support long running tasks and can deterministically sequence Agents, Tools, and People
- Python Tools: Custom Python functions
- Langflow Tools: Langflow-based flows
- API Tools: External service integrations
- MCP Tools: Model Context Protocol tools
- Knowledge Tools: Knowledge base and retrieval tools
- Flow is a Tool: Flow is a special type of tool that provides orchestration capabilities
- Performance at each level affects the others - e.g., slow tools make flows slow, slow flows make agents slow, and nested agent calls compound performance impacts
What You Can Control and Measure
As a wxO SaaS customer, you have control over application-level performance: ✅ What You Control:- Agent configuration and prompts
- Flow design and structure
- Tool implementation and efficiency
- Data mapping strategies
- User interaction design
- External API integrations
- Agent response time and quality
- Flow execution time and breakdown
- Tool execution times
- Task-level performance
- LLM interaction duration
- Error rates and success metrics
- User response times
- Infrastructure scaling and availability
- Platform-level performance
- Orchestration engine optimization
- Database performance
- Network infrastructure
Shared Responsibility Model
In wxO SaaS, performance optimization is a shared responsibility:When to Conduct Performance Testing
Consider performance testing when:- Before deployment: Establish baselines and validate SLAs
- After major changes: Verify performance impact of new features
- During optimization: Measure improvement from changes
- Investigating issues: Diagnose slow or failing agents/flows/tools
- Capacity planning: Understand limits and scaling needs
- Significant time has elapsed since last baseline: Re-establish an accurate baseline for comparisons
How to Use This Guide
For Understanding Performance:- Start with the architecture overview (above)
- Read the relevant section for what you’re optimizing:
- Agent Performance - If agents are slow or inaccurate
- Flow Performance - If flows are slow or inefficient
- Tool Performance - If tools are slow or timing out
- Knowledge Performance - If knowledge retrieval is slow or returning poor results
- Identify the bottleneck level (agent, flow, or tool)
- Read the relevant performance guide (agent, flow, or tool)
- Apply level-specific optimizations from that guide
- Measure improvement
- Review the relevant performance guide (agent, flow, or tool)
- Check the performance testing methodology
- Follow the diagnosis and optimization steps
- Use the Quick Reference section below
- Check performance baselines
- Review optimization checklists
This guide focuses on SaaS deployments. Infrastructure is managed by IBM, so we emphasize application-level optimization that you control.
Understanding Performance Testing
Overview
Not all performance testing is the same. Choosing the right type of test helps you answer specific questions about your agents, flows, and tools. This section helps you identify which tests are most relevant for your needs.Tests Relevant for SaaS Customers
1. Baseline Testing
Purpose: Establish inherent performance characteristics under minimal load When to Use:- Initial development and deployment
- After significant code changes
- Creating performance benchmarks
- Comparing different implementation approaches
- Users: 1-10 concurrent users
- Duration: 15-30 minutes
- Ramp-up: Immediate
- Think Time: 10-30 seconds (realistic user behavior)
- Interactions per Session: 3-5 interactions per agent session
- Minimum execution time for your agent/flow/tool
- Individual component performance
- Baseline for comparison
- “I’ve built an agent with 3 tools. I want to know how fast it runs with a single user.”
- “I’ve created a new Python tool. I want to measure its baseline execution time.”
- “I’ve designed a flow with 5 tasks. I want to establish performance benchmarks.”
2. Load Testing
Purpose: Validate system behavior under expected production load When to Use:- Before production deployment
- Validating SLA compliance
- Testing with realistic user volumes
- Verifying concurrent execution handling
- Users: Expected peak concurrent users
- Duration: 30-60 minutes
- Ramp-up: 10-15 minutes
- Think Time: 10-30 seconds (realistic user behavior - adjust based on use case complexity)
- Interactions per Session: 3-5 interactions per agent session
- Performance under realistic load
- Concurrent execution behavior
- Error rates at scale
- Whether you meet SLA requirements
“I expect 50 concurrent users during peak hours. I want to verify my agent can handle this load while maintaining acceptable response times.”
- IBM manages infrastructure scaling automatically
- Focus on application-level performance
- Contact IBM support if hitting platform limits
Test Case Selection Criteria
Choose test cases based on these criteria:Transaction-Based Selection
Focus on high-frequency operations:- Search and query operations
- Status checks and monitoring
- Real-time data retrieval
- Frequently accessed workflows
Business-Critical Operations
Focus on operations with business impact:- Revenue-generating workflows (payments, orders)
- Customer-facing operations (support, onboarding)
- SLA-bound processes (response time commitments)
- Compliance-required operations (audit, security)
Resource-Intensive Operations
Focus on operations that consume significant resources:- Complex agent interactions with multiple reasoning steps
- Document processing and extraction
- Large data transformations
- Multiple external API calls
- Long-running workflows
What About Stress and Endurance Testing?
Stress Testing (finding breaking points) and Endurance Testing (long-running stability) are not the responsibility of customers in wxO SaaS:- IBM conducts these tests as part of ongoing performance validation of the wxO platform
- IBM manages infrastructure capacity and scaling
- Platform automatically handles load distribution
- Focus your efforts on application-level optimization (baseline and load testing)
- If you suspect platform-level issues, contact IBM support to investigate infrastructure performance
Triggering Agents for Performance Testing
Overview
Before you can access performance data, you need to trigger your agents to generate test data. wxO provides two primary methods for executing agents:Method 1: Chat UI
Best for: Interactive testing and manual validation The wxO Chat UI provides a user-friendly interface for:- Testing agent responses interactively
- Validating agent behavior with real conversations
- Exploring different user inputs and scenarios
Method 2: Orchestrate Runs API
Best for: Baseline testing and load testing The Orchestrate Runs API allows you to:- Execute agents programmatically
- Automate performance testing
- Run baseline tests (1-10 concurrent users)
- Run load tests with multiple concurrent requests
- Integrate agent testing into CI/CD pipelines
Detailed Testing Guidance
For comprehensive information on agent testing methodology, test scenarios, and best practices, see:- Agent Performance Guide - Section: “How to Test Agent Performance”
Accessing Performance Data
Overview
wxO provides multiple methods for accessing performance data:- Built-in Monitoring UI - Visual interface for exploring traces
- Programmatic API Access - Retrieve traces via REST API for automation
- Trace CLI - Command-line interface for trace analysis (wxO ADK v2.4.0+)
Method 1: Built-in Monitoring UI
Documentation: IBM watsonx Orchestrate - Monitoring AgentsMethod 2: Programmatic API Access
There is no direct correlation between agent runs and trace IDs. To retrieve traces:
- Execute your agent using the orchestrate runs API or other method
- Search for traces using the searchTraces API by time range and agent ID to find the trace_id
- Retrieve trace spans using the Get Spans for Trace API
Method 3: Trace CLI
Documentation: Traces with CLI Available in: wxO ADK v2.4.0 and later For detailed usage and examples, see the Trace CLI documentation.Quick Reference
Performance Characteristics by Level
Agent Performance
What to Measure:- Total response time
- Number of reasoning loops
- Tool calls made
- Success rate and accuracy
- Prompt engineering
- Tool selection strategy
- Context management
- Model selection
Flow Performance
What to Measure:- Total execution time
- Per-task execution time
- Orchestration overhead
- User interaction time
- Task count reduction
- Data mapping strategy
- Parallel execution
- User interaction design
Tool Performance
Characteristics:- Python tools: Typically sub-second for simple operations
- Langflow tools: Minimum 2+ seconds due to Langflow initialization
- API tools: Varies based on external service
- Knowledge tools: Varies based on repository type and search strategy
- Timeout limit: 2 minutes maximum
- Individual tool execution time
- External API latency
- Knowledge retrieval time
- Algorithm efficiency
- API call batching
- Tool type selection
- Knowledge search strategy
Common Pitfalls
Agent Level:- ❌ Using Agents for simple text generation → ✅ Use Generative Prompts in Flow
- ❌ Too many tools available → ✅ Limit to relevant tools only
- ❌ Vague prompts → ✅ Use specific, clear prompts
- ❌ Ignoring accuracy metrics → ✅ Balance speed and quality
- ❌ Extensive guidelines → ✅ Keep guidelines concise and focused
- ❌ Inefficient pre/post plugins → ✅ Optimize plugin code for performance
- ❌ Using auto-mapping for well-defined schemas → ✅ Use explicit data mapping for known, stable schemas (auto-mapping provides robust tool/agent response handling but adds latency)
- ❌ Too many small tasks → ✅ Combine related operations
- ❌ Not pre-filling forms → ✅ Use context to populate fields
- ❌ Sequential when parallel possible → ✅ Run independent tasks concurrently
- ❌ Using Langflow for simple deterministic logic → ✅ Use Python tools or just code block in Flows
- ❌ Multiple sequential API calls → ✅ Batch into single call
- ❌ Trying to persist state → ✅ Use external state management
- ❌ Ignoring 2-minute timeout → ✅ Design for timeout constraints
Key Performance Factors
Agent Performance Factors:- Prompt complexity and clarity
- Number of available tools
- Reasoning loop iterations
- LLM model selection
- Context size
- Guidelines (extensive guidelines can result in latency)
- Number of tasks
- Data mapping strategy
- Task dependencies
- User interaction design
- Agent context retrieval
- Tool type
- Algorithm efficiency
- External API latency
- Data volume
- Custom caching strategy (tool developers can implement caching in external services)
Resources and Links
- Agent Performance: performance-guide-v2-agent
- Flow Performance: performance-guide-v2-flow
- Tool Performance: performance-guide-v2-tools
- Knowledge Performance: performance-guide-v2-knowledge
- Monitoring Documentation: https://www.ibm.com/docs/en/watsonx/watson-orchestrate/base?topic=agents-monitoring
- Trace API Documentation: https://developer.ibm.com/apis/catalog/watsonorchestrate—custom-assistants/api/API—watsonorchestrate—observability-and-tracing#searchTraces
- Evaluation Framework: https://developer.watson-orchestrate.ibm.com/evaluate/overview
- IBM Support: Contact for platform-level issues
Next Steps
- Understand your architecture: Review the hierarchy above
- Identify your bottleneck: Agent, Flow, Tool, or Knowledge level?
- Read the relevant guide:
- Apply optimizations: Use strategies from the relevant performance guide
- Monitor and iterate: Continuous improvement