

ibm-watsonx-orchestrate-sdk observability decorators to instrument a LangGraph-based agent.
LangGraph is a Python framework for building stateful, graph-based AI agents whose logic is expressed as nodes in a StateGraph. The SDK manages span creation, nesting, authentication, and export internally, so only a few decorator additions to your agent code are required.
Use this approach when:
- Your agent is built with LangGraph.
- You want the finest level of trace detail: per-LLM-call, per-tool-call, and per-agent-node spans with structured metadata.
- You prefer decorator-based instrumentation over manually writing tracer and exporter code.
How it works
The SDK wraps the same OpenTelemetry export pipeline as the OpenTelemetry export approach, but manages it for you:- Initialize a
Clientwith your API key and instance URL. - Create a
TracerConfigthat identifies the agent and workspace that the exported spans belong to, by using the registered agent’sagent_id,workspace_id, and environment. On AWS deployments, the SDK derives the tenant context automatically from the JWT token. On IBM Cloud, passtenant_idexplicitly because the IAM token does not contain tenant information. - Build a
Tracerfrom the configuration and register it globally withregister_tracer()to make it available to all SDK decorators. - Apply decorators to the relevant functions. Each decorator is a Python
@annotation that intercepts function calls at runtime to create and export spans without modifying your function logic.
Before you begin
Complete the following setup before you instrument your agent:- Import the LangGraph agent through the watsonx Orchestrate UI to create an agent entry and obtain a valid Agent ID. For more information, see Importing LangGraph agents.
- Copy the Agent ID from the registered agent.
- For IBM Cloud: Copy the Workspace ID. Call the List workspaces API to fetch the workspaces from a tenant.
-
Copy the Tenant ID for your instance. The Tenant ID has the format
<account-id>_<instance-id>. Obtain it in one of the following ways:- From the instance CRN in Profile > About.
- From the browser DevTools console, run
WO_Metato retrieve its properties.
Client. On IBM Cloud, the IAM token does not contain tenant information, so you must pass the Tenant ID explicitly astenant_idinTracerConfig. - Obtain an API key and the corresponding IAM or MCSP token URL that is authorized to call the trace ingestion endpoint. For more information, see Authenticating to the API.
-
Note the instance URL for your watsonx Orchestrate instance. This URL is the base URL of the ingestion endpoint and has the format
https://api.watson-orchestrate.ibm.com/instances/<instance-id>. For more information, see Getting the API endpoint.
Procedure
Installing the SDK
Because the SDK is currently a pre-release build, install it from Test PyPI.To perform a quick install, run:For a project with a Then install the dependencies:
BASH
requirements.txt, add the following entries:BASH
Configuring the tracer
At module load time, create a Key points:
Client, build a TracerConfig, and register the tracer globally. Complete this step once, before any decorated functions are called.- AWS
- IBM Cloud
Python
- Pass
api_keyandinstance_urltoClient. - On AWS, the SDK derives the tenant context automatically from the JWT token, so
tenant_idis not required. - On IBM Cloud, the IAM API key generates a user-level token that does not include tenant information. Pass
tenant_idexplicitly inTracerConfigto avoid aValueError: Trace injection mode requires the following parameters: tenant_idat startup. - The only valid values for
environmentare"draft"and"live". TracerusesDynamicAuthOTLPSpanExporterto refresh tokens automatically. Long-running agent processes do not need to be restarted when an access token expires.
Decorating agent functions
Apply the SDK decorators to the functions that make up your agent. Manual span creation is not required.The following table shows which decorator to apply and where:General-purpose helper calls:
Use Tool calls:
Use LLM calls:
Wrap the function that invokes the LLM with Agent node:
Apply Graph factory:
Apply
General-purpose helper calls: @trace_call
Use @trace_call for helper logic such as validation or response formatting. Set capture_input=True or capture_output=True to record function arguments and return values as span attributes.Python
Tool calls: @trace_tool_call
Use @trace_tool_call on functions that are also decorated with LangChain’s @tool decorator. The SDK records each tool invocation as a distinct span with tool-specific metadata.@tool must be the outermost decorator. Place @tool above @trace_tool_call in the source file, with @trace_tool_call applied directly to the function.Python
LLM calls: @trace_llm_call
Wrap the function that invokes the LLM with @trace_llm_call. Set model and provider so that the analytics view correctly attributes token and latency metrics.Python
Agent node: @trace_agent_call
Apply @trace_agent_call to the top-level LangGraph node that represents the agent decision step. The agent_name parameter labels this trace in the analytics view. The agent_id in TracerConfig identifies the watsonx Orchestrate agent instance to which the trace belongs.Python
Graph factory: @configure_tracing
Apply @configure_tracing to the factory function that builds and returns the LangGraph StateGraph. This decorator propagates tracing context through the compiled graph.Python
Result
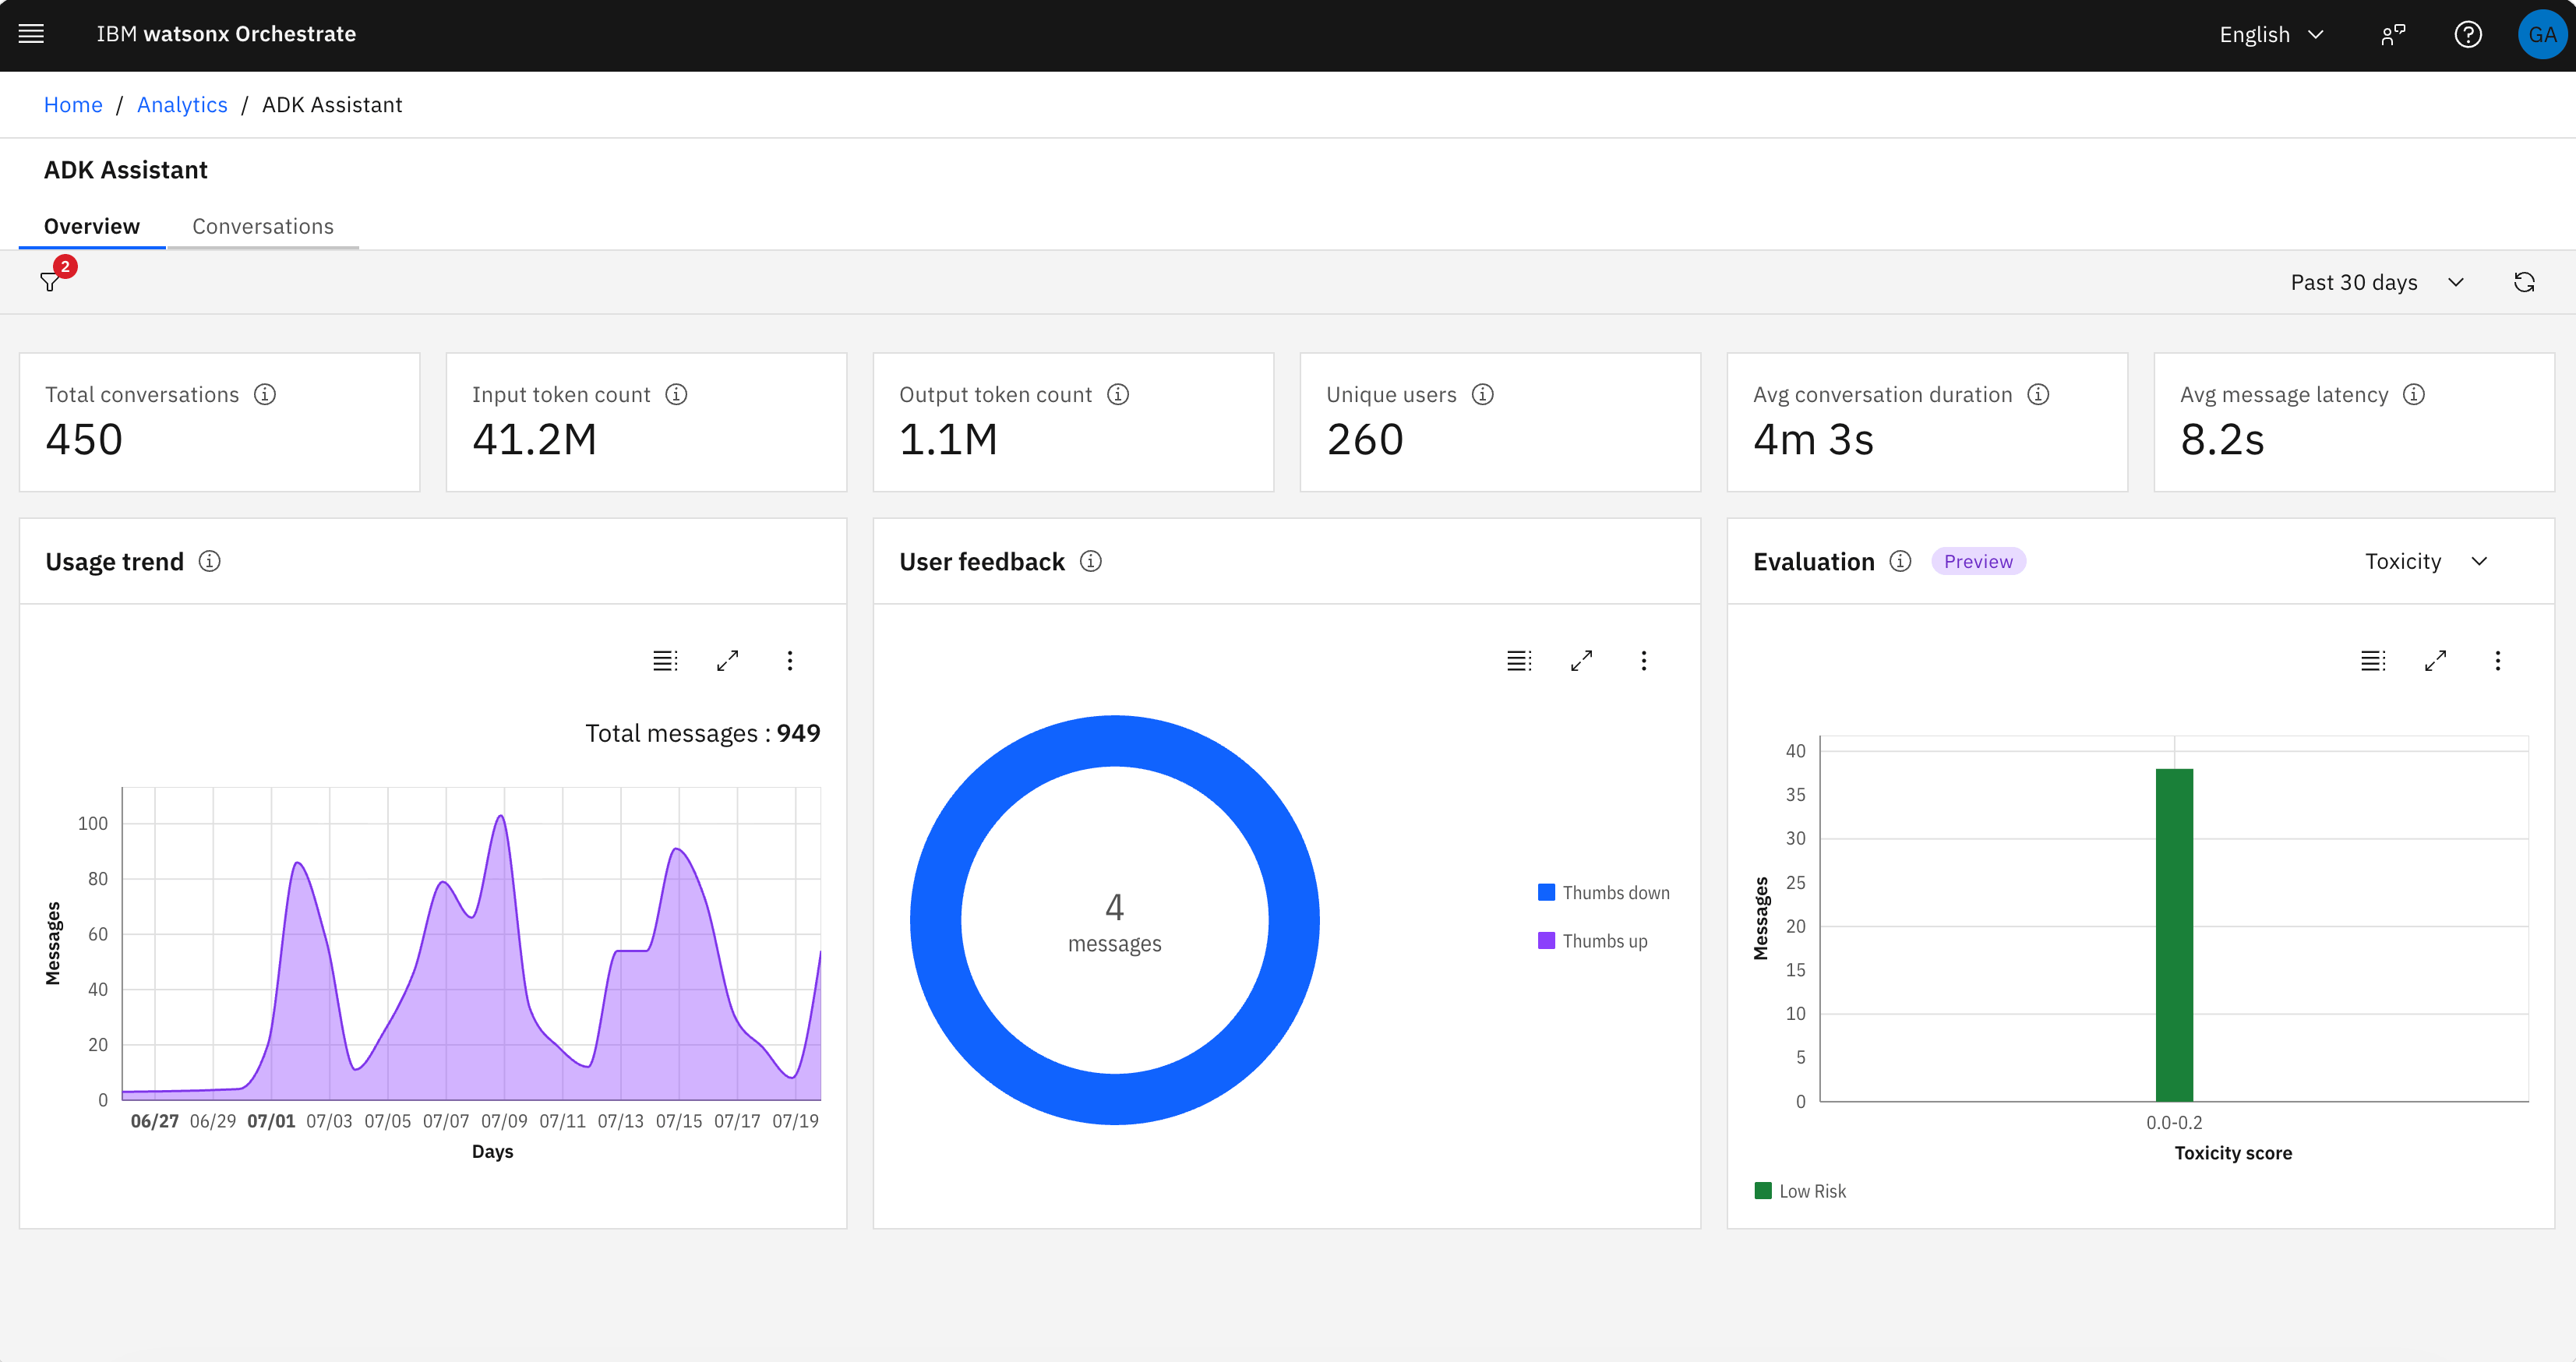
After the decorated agent runs, the SDK exports the captured spans to watsonx Orchestrate by using theClient credentials and the configured agent_id and tenant context. The traces are visible in watsonx Orchestrate under Analyze > [Agent name] > Overview and Conversations. Per-call span detail is available in the Conversations drill-down view.
Troubleshooting
Verifying trace ingestion
If traces do not appear on the Analytics page, use the Get Traces API to confirm whether the ingestion endpoint received them. If the API returns your traces, ingestion was successful. If the Get Traces API returns an empty list, the spans were not received. Check the following items:401 Unauthorizedon startup: The API key or instance URL passed toClientis incorrect. Verify that both values match the watsonx Orchestrate instance where the agent is registered.- Token expiry during a long run: The
DynamicAuthOTLPSpanExporterrefreshes tokens automatically. If authentication failures persist, confirm that the API key has not been revoked and that the instance URL is reachable from the agent host. agent_idorworkspace_idnot found: The values passed toTracerConfigmust match the Agent ID and Workspace ID shown in the watsonx Orchestrate UI for the registered agent. Verify both values against the registration entry.@configure_tracingnot applied: If@configure_tracingis missing from the graph factory function, tracing context is not propagated through the compiled graph, and child spans may not be associated with the correct root span.